

Invest in 5,000+ US Stocks and ETFs
* Offering through VF Securities, Inc. (member FINRA/SIPC)
 Skip to content
Microsoft Corporation develops and supports software, services, devices and solutions worldwide. The Productivity and Business Processes segment offers office, exchange, SharePoint, Microsoft Teams, office 365 Security and Compliance, Microsoft viva, and Microsoft 365 copilot; and office consumer services, such as Microsoft 365 consumer subscriptions, Office licensed on-premises, and other office services. This segment also provides LinkedIn; and dynamics business solutions, including Dynamics 365, a set of intelligent, cloud-based applications across ERP, CRM, power apps, and power automate; and on-premises ERP and CRM applications. The Intelligent Cloud segment offers server products and cloud services, such as azure and other cloud services; SQL and windows server, visual studio, system center, and related client access licenses, as well as nuance and GitHub; and enterprise services including enterprise support services, industry solutions, and nuance professional services. The More Personal Computing segment offers Windows, including windows OEM licensing and other non-volume licensing of the Windows operating system; Windows commercial comprising volume licensing of the Windows operating system, windows cloud services, and other Windows commercial offerings; patent licensing; and windows Internet of Things; and devices, such as surface, HoloLens, and PC accessories. Additionally, this segment provides gaming, which includes Xbox hardware and content, and first- and third-party content; Xbox game pass and other subscriptions, cloud gaming, advertising, third-party disc royalties, and other cloud services; and search and news advertising, which includes Bing, Microsoft News and Edge, and third-party affiliates. The company sells its products through OEMs, distributors, and resellers; and directly through digital marketplaces, online, and retail stores. The company was founded in 1975 and is headquartered in Redmond, Washington. more
| Time Frame | MSFT | Sector | S&P500 |
|---|---|---|---|
| 1-Week Return | 0.08% | -1.39% | -0.64% |
| 1-Month Return | -3.28% | -4.98% | -2.75% |
| 3-Month Return | 0.43% | -2.62% | 2.89% |
| 6-Month Return | 15.71% | 15.17% | 17.07% |
| 1-Year Return | 34.69% | 34.01% | 25.71% |
| 3-Year Return | 65.72% | 45.11% | 26.45% |
| 5-Year Return | 231.43% | 162.76% | 86.7% |
| 10-Year Return | 1117.93% | 515.58% | 222.9% |
| Jun '19 | Jun '20 | Jun '21 | Jun '22 | Jun '23 | 5YR TREND | |
|---|---|---|---|---|---|---|
| Total Revenue | 125.84B | 143.01B | 168.09B | 198.27B | 211.91B | [{"date":"2019-06-30","value":59.38,"profit":true},{"date":"2020-06-30","value":67.49,"profit":true},{"date":"2021-06-30","value":79.32,"profit":true},{"date":"2022-06-30","value":93.56,"profit":true},{"date":"2023-06-30","value":100,"profit":true}] |
| Cost of Revenue | 42.91B | 46.08B | 52.23B | 62.65B | 65.86B | [{"date":"2019-06-30","value":65.15,"profit":true},{"date":"2020-06-30","value":69.96,"profit":true},{"date":"2021-06-30","value":79.3,"profit":true},{"date":"2022-06-30","value":95.12,"profit":true},{"date":"2023-06-30","value":100,"profit":true}] |
| Gross Profit | 82.93B | 96.94B | 115.86B | 135.62B | 146.05B | [{"date":"2019-06-30","value":56.78,"profit":true},{"date":"2020-06-30","value":66.37,"profit":true},{"date":"2021-06-30","value":79.33,"profit":true},{"date":"2022-06-30","value":92.86,"profit":true},{"date":"2023-06-30","value":100,"profit":true}] |
| Gross Margin | 65.90% | 67.78% | 68.93% | 68.40% | 68.92% | [{"date":"2019-06-30","value":95.61,"profit":true},{"date":"2020-06-30","value":98.34,"profit":true},{"date":"2021-06-30","value":100,"profit":true},{"date":"2022-06-30","value":99.24,"profit":true},{"date":"2023-06-30","value":99.99,"profit":true}] |
| Operating Expenses | 39.97B | 43.98B | 45.94B | 52.24B | 57.53B | [{"date":"2019-06-30","value":69.48,"profit":true},{"date":"2020-06-30","value":76.44,"profit":true},{"date":"2021-06-30","value":79.86,"profit":true},{"date":"2022-06-30","value":90.8,"profit":true},{"date":"2023-06-30","value":100,"profit":true}] |
| Operating Income | 42.96B | 52.96B | 69.92B | 83.38B | 88.52B | [{"date":"2019-06-30","value":48.53,"profit":true},{"date":"2020-06-30","value":59.83,"profit":true},{"date":"2021-06-30","value":78.98,"profit":true},{"date":"2022-06-30","value":94.19,"profit":true},{"date":"2023-06-30","value":100,"profit":true}] |
| Total Non-Operating Income/Expense | (2.03B) | (2.60B) | 1.19B | 333.00M | 788.00M | [{"date":"2019-06-30","value":-171.42,"profit":false},{"date":"2020-06-30","value":-219.48,"profit":false},{"date":"2021-06-30","value":100,"profit":true},{"date":"2022-06-30","value":28.08,"profit":true},{"date":"2023-06-30","value":66.44,"profit":true}] |
| Pre-Tax Income | 43.69B | 53.04B | 71.10B | 83.72B | 89.31B | [{"date":"2019-06-30","value":48.92,"profit":true},{"date":"2020-06-30","value":59.38,"profit":true},{"date":"2021-06-30","value":79.61,"profit":true},{"date":"2022-06-30","value":93.74,"profit":true},{"date":"2023-06-30","value":100,"profit":true}] |
| Income Taxes | 4.45B | 8.76B | 9.83B | 10.98B | 16.95B | [{"date":"2019-06-30","value":26.24,"profit":true},{"date":"2020-06-30","value":51.65,"profit":true},{"date":"2021-06-30","value":58,"profit":true},{"date":"2022-06-30","value":64.77,"profit":true},{"date":"2023-06-30","value":100,"profit":true}] |
| Income After Taxes | 39.24B | 44.28B | 61.27B | 72.74B | 72.36B | [{"date":"2019-06-30","value":53.95,"profit":true},{"date":"2020-06-30","value":60.88,"profit":true},{"date":"2021-06-30","value":84.24,"profit":true},{"date":"2022-06-30","value":100,"profit":true},{"date":"2023-06-30","value":99.48,"profit":true}] |
| Income From Continuous Operations | 39.24B | 44.28B | 61.27B | 72.74B | 72.36B | [{"date":"2019-06-30","value":53.95,"profit":true},{"date":"2020-06-30","value":60.88,"profit":true},{"date":"2021-06-30","value":84.24,"profit":true},{"date":"2022-06-30","value":100,"profit":true},{"date":"2023-06-30","value":99.48,"profit":true}] |
| Income From Discontinued Operations | - | - | - | - | - | [{"date":"2019-06-30","value":"-","profit":true},{"date":"2020-06-30","value":"-","profit":true},{"date":"2021-06-30","value":"-","profit":true},{"date":"2022-06-30","value":"-","profit":true},{"date":"2023-06-30","value":"-","profit":true}] |
| Net Income | 39.24B | 44.28B | 61.27B | 72.74B | 72.36B | [{"date":"2019-06-30","value":53.95,"profit":true},{"date":"2020-06-30","value":60.88,"profit":true},{"date":"2021-06-30","value":84.24,"profit":true},{"date":"2022-06-30","value":100,"profit":true},{"date":"2023-06-30","value":99.48,"profit":true}] |
| EPS (Diluted) | 4.75 | 5.75 | 7.97 | 9.20 | 9.81 | [{"date":"2019-06-30","value":48.42,"profit":true},{"date":"2020-06-30","value":58.61,"profit":true},{"date":"2021-06-30","value":81.24,"profit":true},{"date":"2022-06-30","value":93.78,"profit":true},{"date":"2023-06-30","value":100,"profit":true}] |
These ratios help you determine the liquidity of the company. Higher is better.
| MSFT | |
|---|---|
| Cash Ratio | 0.68 |
| Current Ratio | 1.24 |
| Quick Ratio | 1.23 |
These ratios help you understand the company's efficiency in using its assets to generate returns. Higher is better. For ROE, average long term is around 14%, less than 10% is poor.
| MSFT | |
|---|---|
| ROA (LTM) | 15.30% |
| ROE (LTM) | 38.49% |
These ratios help you understand the company's liabilities, gauging the riskiness of the investment.
| MSFT | |
|---|---|
| Debt Ratio Lower is generally better. Negative is bad. | 0.48 |
| Common Equity/Total Assets Higher is better. Lower can suggest investment is riskier. | 0.52 |
| Debt/Equity The higher the number, the more leverage the business employs, the riskier the investment typically is. | 1.91 |
These ratios help you understand the company's valuation. Lower may indicate cheaper stocks.
| MSFT | |
|---|---|
| Trailing PE | 34.47 |
| Forward PE | 29.94 |
| P/S (TTM) | 13.03 |
| P/B | 12.45 |
| Price/FCF | 141 |
| EV/R | 13.06 |
| EV/Ebitda | 24.59 |
| PEG | 1.37 |

Asian shares were mostly higher on Monday after Wall Street ended last week with the stock market’s best day in over two months in a rally backed by the cooler-than-expected U.S. employment data. U.S. futures edged higher and oil prices rose. The Japanese yen weakened slightly after its value swung from a low of 160.25 to the U.S. dollar to 151.86 late last week following suspected government intervention. The dollar bought 153.93 yen, up from 152.90 yen. Japanese Finance Minister Shunichi Suzuki told a gathering at the Asian Development Bank’s annual meeting Friday, held in Tiblisi, Georgia, that rapid fluctuations were hurting households and businesses. The euro rose to $1.0765 from $1.0763. The Hang Seng in Hong Kong lost 0.2% to 18,447.12 while the Shanghai Composite index rose 0.9% to 3,133.92 as markets reopened after a weeklong holiday. A private sector survey Monday showed the country’s services sector grew at a slower pace in April due to rising costs although new orders rose and business sentiment improved.

Ahmed Mazhari, president at Microsoft Asia, discusses the company''s investments in Asia and says India has a "great number of graduates but how many of them have the skills and the proficiencies of today?" He adds that Microsoft is "creating programs and skills for them to participate in."

Artificial intelligence, especially the newer generative AI technology, made a splash when it hit the scene, and we’re still watching to see just h…

What Is The Dirty Stream Vulnerability All About? Image: Google Microsoft makes the biggest desktop OS in the world and they’ve done a lot to collaborate with the Android platform. Well, this time around, they’ve come to report on a major security issue that might be present in countless apps for Android. This security vulnerability […] The post Microsoft Reports An Android App Vulnerability: Dirty Stream appeared first on TECHTELEGRAPH .

MICROSOFT Continue reading on Medium »
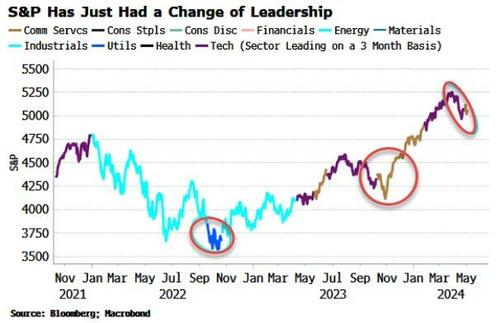
Change Of S&P Leadership Suggests Bottom Is Near Authored by Simon White, Bloomberg macro strategist, A change in sector leadership in US stocks suggests the correction might soon be over and a bottom is not too far away. The tech sector has led the recent advance in the US stock-market (i.e. the sector with the highest three-month return on a three-month smoothed basis), but in the last two weeks it lost that mantle to the communication services sector. (Tech stocks are leading today after the payrolls miss, but on a three-month return on a three-month smoothed basis communication services are still ahead.) As the chart shows, the two previous market corrections were accompanied by a change of leadership. But that change came near the bottom and ahead of the next advance. The tech sector is lagging as its main constituents, Microsoft, Apple and Nvidia, have been lagging, while the communication services sector, predominately Meta and Google, went into the lead, driven the latter’s positive earnings surprise last week.

… class in the Android software development kit. Further, … Beyond just the hypothetical, Microsoft also discovered this vulnerability pattern … Android apps on the Google Play Store. This included … vendors have worked with Microsoft to fix the issues …

As the stock market navigates a temporary dip, savvy investors are looking for cloud computing stocks to buy. Wall Street recently concluded a challenging month with significant declines across major indexes. The S&P 500 fell as much as 5.5% in April and ended the month down 1.6%, marking its first losing month in six. These losses were largely caused by growing concerns about persistent high inflation and interest rates. However, as the stock market faces a period of downturn, cloud computing stocks provide a prime buying opportunity for investors. With businesses increasingly dependent on digital infrastructure, cloud computing plays a crucial role in enabling remote work, data management and enhanced cybersecurity. The cloud computing market is projected to reach $1,844 billion by 2031. The market is expected to grow at a CAGR of 18.9% from 2023 to 2031. Therefore, investing in cloud computing stocks during a market downturn can be a savvy strategic move. Hence, three cloud computing stocks appear undervalued in the current climate and may offer significant upside as the market stabilizes.

KUALA LUMPUR: Microsoft ’s recent announcement of US$ … ,” he shared. Rafizi mentioned that Microsoft CEO Satya Nadella highlighted a …
Microsoft Corporation (MSFT) share price today is $406.66
Yes, Indians can buy shares of Microsoft Corporation (MSFT) on Vested. To buy Microsoft Corporation from India, you can open a US Brokerage account on Vested today by clicking on Sign Up or Invest in MSFT stock at the top of this page. The account opening process is completely digital and secure, and takes a few minutes to complete.
Yes, you can purchase fractional shares of Microsoft Corporation (MSFT) via the Vested app. You can start investing in Microsoft Corporation (MSFT) with a minimum investment of $1.
You can invest in shares of Microsoft Corporation (MSFT) via Vested in three simple steps:
The 52-week high price of Microsoft Corporation (MSFT) is $430.82. The 52-week low price of Microsoft Corporation (MSFT) is $303.6.
The price-to-earnings (P/E) ratio of Microsoft Corporation (MSFT) is 35.25
The price-to-book (P/B) ratio of Microsoft Corporation (MSFT) is 12.45
The dividend yield of Microsoft Corporation (MSFT) is 0.75%
The market capitalization of Microsoft Corporation (MSFT) is $3.02T
The stock symbol (or ticker) of Microsoft Corporation is MSFT
 Link copied


