

Invest in 5,000+ US Stocks and ETFs
* Offering through VF Securities, Inc. (member FINRA/SIPC)
 Skip to content
Meta Platforms, Inc. engages in the development of products that enable people to connect and share with friends and family through mobile devices, personal computers, virtual reality headsets, and wearables worldwide. It operates in two segments, Family of Apps and Reality Labs. The Family of Apps segment offers Facebook, which enables people to share, discuss, discover, and connect with interests; Instagram, a community for sharing photos, videos, and private messages, as well as feed, stories, reels, video, live, and shops; Messenger, a messaging application for people to connect with friends, family, communities, and businesses across platforms and devices through text, audio, and video calls; and WhatsApp, a messaging application that is used by people and businesses to communicate and transact privately. The Reality Labs segment provides augmented and virtual reality related products comprising consumer hardware, software, and content that help people feel connected, anytime, and anywhere. The company was formerly known as Facebook, Inc. and changed its name to Meta Platforms, Inc. in October 2021. The company was incorporated in 2004 and is headquartered in Menlo Park, California more
| Time Frame | META | Sector | S&P500 |
|---|---|---|---|
| 1-Week Return | 1.96% | -0.92% | -0.64% |
| 1-Month Return | -10.81% | -4.15% | -2.75% |
| 3-Month Return | -1.52% | 1.23% | 2.89% |
| 6-Month Return | 43.81% | 18.09% | 17.07% |
| 1-Year Return | 90.88% | 36.82% | 25.71% |
| 3-Year Return | 40.26% | 5.03% | 26.45% |
| 5-Year Return | 131.46% | 65.62% | 86.7% |
| 10-Year Return | 639.04% | 67.34% | 222.9% |
| Dec '19 | Dec '20 | Dec '21 | Dec '22 | Dec '23 | 5YR TREND | |
|---|---|---|---|---|---|---|
| Total Revenue | 70.70B | 85.97B | 117.93B | 116.61B | 134.90B | [{"date":"2019-12-31","value":52.41,"profit":true},{"date":"2020-12-31","value":63.72,"profit":true},{"date":"2021-12-31","value":87.42,"profit":true},{"date":"2022-12-31","value":86.44,"profit":true},{"date":"2023-12-31","value":100,"profit":true}] |
| Cost of Revenue | 12.77B | 16.69B | 22.65B | 25.25B | 25.96B | [{"date":"2019-12-31","value":49.19,"profit":true},{"date":"2020-12-31","value":64.3,"profit":true},{"date":"2021-12-31","value":87.25,"profit":true},{"date":"2022-12-31","value":97.26,"profit":true},{"date":"2023-12-31","value":100,"profit":true}] |
| Gross Profit | 57.93B | 69.27B | 95.28B | 91.36B | 108.94B | [{"date":"2019-12-31","value":53.17,"profit":true},{"date":"2020-12-31","value":63.59,"profit":true},{"date":"2021-12-31","value":87.46,"profit":true},{"date":"2022-12-31","value":83.86,"profit":true},{"date":"2023-12-31","value":100,"profit":true}] |
| Gross Margin | 81.94% | 80.58% | 80.79% | 78.35% | 80.76% | [{"date":"2019-12-31","value":100,"profit":true},{"date":"2020-12-31","value":98.35,"profit":true},{"date":"2021-12-31","value":98.61,"profit":true},{"date":"2022-12-31","value":95.62,"profit":true},{"date":"2023-12-31","value":98.56,"profit":true}] |
| Operating Expenses | 33.94B | 36.60B | 48.53B | 62.42B | 62.19B | [{"date":"2019-12-31","value":54.38,"profit":true},{"date":"2020-12-31","value":58.64,"profit":true},{"date":"2021-12-31","value":77.75,"profit":true},{"date":"2022-12-31","value":100,"profit":true},{"date":"2023-12-31","value":99.64,"profit":true}] |
| Operating Income | 23.99B | 32.67B | 46.75B | 28.94B | 46.75B | [{"date":"2019-12-31","value":51.3,"profit":true},{"date":"2020-12-31","value":69.88,"profit":true},{"date":"2021-12-31","value":100,"profit":true},{"date":"2022-12-31","value":61.91,"profit":true},{"date":"2023-12-31","value":100,"profit":true}] |
| Total Non-Operating Income/Expense | 748.00M | 346.00M | 601.00M | (526.00M) | 1.35B | [{"date":"2019-12-31","value":55.24,"profit":true},{"date":"2020-12-31","value":25.55,"profit":true},{"date":"2021-12-31","value":44.39,"profit":true},{"date":"2022-12-31","value":-38.85,"profit":false},{"date":"2023-12-31","value":100,"profit":true}] |
| Pre-Tax Income | 24.81B | 33.18B | 47.28B | 28.82B | 47.43B | [{"date":"2019-12-31","value":52.32,"profit":true},{"date":"2020-12-31","value":69.96,"profit":true},{"date":"2021-12-31","value":99.7,"profit":true},{"date":"2022-12-31","value":60.76,"profit":true},{"date":"2023-12-31","value":100,"profit":true}] |
| Income Taxes | 6.33B | 4.03B | 7.91B | 5.62B | 8.33B | [{"date":"2019-12-31","value":75.95,"profit":true},{"date":"2020-12-31","value":48.43,"profit":true},{"date":"2021-12-31","value":95.01,"profit":true},{"date":"2022-12-31","value":67.45,"profit":true},{"date":"2023-12-31","value":100,"profit":true}] |
| Income After Taxes | 18.48B | 29.15B | 39.37B | 23.20B | 39.10B | [{"date":"2019-12-31","value":46.95,"profit":true},{"date":"2020-12-31","value":74.03,"profit":true},{"date":"2021-12-31","value":100,"profit":true},{"date":"2022-12-31","value":58.93,"profit":true},{"date":"2023-12-31","value":99.31,"profit":true}] |
| Income From Continuous Operations | 18.48B | 29.15B | 39.37B | 23.20B | 29.73B | [{"date":"2019-12-31","value":46.95,"profit":true},{"date":"2020-12-31","value":74.03,"profit":true},{"date":"2021-12-31","value":100,"profit":true},{"date":"2022-12-31","value":58.93,"profit":true},{"date":"2023-12-31","value":75.52,"profit":true}] |
| Income From Discontinued Operations | - | - | - | - | - | [{"date":"2019-12-31","value":"-","profit":true},{"date":"2020-12-31","value":"-","profit":true},{"date":"2021-12-31","value":"-","profit":true},{"date":"2022-12-31","value":"-","profit":true},{"date":"2023-12-31","value":"-","profit":true}] |
| Net Income | 18.48B | 29.15B | 39.37B | 23.20B | 39.10B | [{"date":"2019-12-31","value":46.95,"profit":true},{"date":"2020-12-31","value":74.03,"profit":true},{"date":"2021-12-31","value":100,"profit":true},{"date":"2022-12-31","value":58.93,"profit":true},{"date":"2023-12-31","value":99.31,"profit":true}] |
| EPS (Diluted) | 8.56 | 9.79 | 13.80 | 8.58 | 14.90 | [{"date":"2019-12-31","value":57.45,"profit":true},{"date":"2020-12-31","value":65.7,"profit":true},{"date":"2021-12-31","value":92.62,"profit":true},{"date":"2022-12-31","value":57.58,"profit":true},{"date":"2023-12-31","value":100,"profit":true}] |
These ratios help you determine the liquidity of the company. Higher is better.
| META | |
|---|---|
| Cash Ratio | 2.07 |
| Current Ratio | 2.68 |
These ratios help you understand the company's efficiency in using its assets to generate returns. Higher is better. For ROE, average long term is around 14%, less than 10% is poor.
| META | |
|---|---|
| ROA (LTM) | 17.31% |
| ROE (LTM) | 33.36% |
These ratios help you understand the company's liabilities, gauging the riskiness of the investment.
| META | |
|---|---|
| Debt Ratio Lower is generally better. Negative is bad. | 0.33 |
| Common Equity/Total Assets Higher is better. Lower can suggest investment is riskier. | 0.67 |
| Debt/Equity The higher the number, the more leverage the business employs, the riskier the investment typically is. | 1.49 |
These ratios help you understand the company's valuation. Lower may indicate cheaper stocks.
| META | |
|---|---|
| Trailing PE | 25.44 |
| Forward PE | 25.32 |
| P/S (TTM) | 9.67 |
| P/B | 8.51 |
| Price/FCF | 87 |
| EV/R | 9.46 |
| EV/Ebitda | 21.61 |
| PEG | 0.19 |
MONTGOMERY, Ala. – Governor Kay Ivey on Thursday, May 2, announced that technology company Meta Platforms plans to open an $800 million data center in Alabama’s capital city that will support 100 operational jobs and build on the company’s previous investment in the state. Meta’s new 715,000-square-foot, AI-optimized data center will be built off Interstate […]
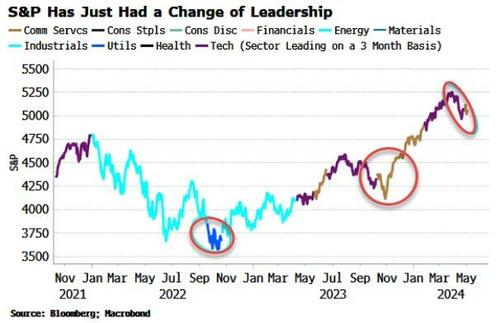
Change Of S&P Leadership Suggests Bottom Is Near Authored by Simon White, Bloomberg macro strategist, A change in sector leadership in US stocks suggests the correction might soon be over and a bottom is not too far away. The tech sector has led the recent advance in the US stock-market (i.e. the sector with the highest three-month return on a three-month smoothed basis), but in the last two weeks it lost that mantle to the communication services sector. (Tech stocks are leading today after the payrolls miss, but on a three-month return on a three-month smoothed basis communication services are still ahead.) As the chart shows, the two previous market corrections were accompanied by a change of leadership. But that change came near the bottom and ahead of the next advance. The tech sector is lagging as its main constituents, Microsoft, Apple and Nvidia, have been lagging, while the communication services sector, predominately Meta and Google, went into the lead, driven the latter’s positive earnings surprise last week.

Analysis of Facebook data finds engagement with news is at an all-time low – due at least in part to changes to Meta’s algorithms Get our morning and afternoon news emails , free app or daily news podcast Meta has refused to enter into new deals with Australian media publishers for the use of their content on Facebook, leading to fears it may again implement a ban on news content appearing on the platform. But an analysis of Facebook data suggests engagement with posts from news organisations is already at an all-time low, as memes fill the space. Meta has argued that news makes up just 3% of what people engage with on its services. Continue reading…

Alphabet and Meta Platforms are two stocks that appear in many hedge funds.

The stock market is filled with many opportunities, but some promising picks lose value in the short run. Some of these dips only last a few days, while others can extend for several months. When great stocks go on sale, investors can accumulate more shares with the same amount of capital. These bargain deals don’t last forever, as investors soon remember the long-term growth prospects of stocks on the discount rack. These discounted stocks have outperformed the market but are offering investors a second chance due to recent pullbacks. Meta Platforms (META) Source: rafapress / Shutterstock.com Meta Platforms (NASDAQ: META ) has become the most undervalued stock among the Magnificent Seven cohort. Shares dropped 10% on a good earnings report. Some investors wanted more, but the company delivered good earnings and only trades at a 25.9 P/E ratio. Revenue increased by 27% year-over-year (YoY), while net income surged by 117% YoY. Daily active users grew 7% YoY to reach 3.24 billion users among its platforms.

In the January-toMarch quarter, Amazon’s cloud computing arm Amazon Web Services, Microsoft’s Azure and Google Cloud grew at 17%, 31% and 28%, respectively, the companies reported. Analysts said this was a sign that AI is contributing to the growth and that overall cloud spending is also accelerating, Reuters reported. On the other hand, Meta CEO Mark Zuckerberg in its earnings call emphasised the company’s longterm investment in AI, which led to its shares sinking by 19% on Wednesday, wiping out over $200 billion in market capitalisation.

Investors are worried history is repeating itself with Meta Platforms.

WASHINGTON, D.C.: Google''s preeminence as an internet search engine is an illegal monopoly propped up by more than $20 billion spent each year by the tech giant to lock out competition, Justice Department lawyers argued at the closings of a high-stakes antitrust lawsuit. Google, on the other hand, maintains that its ubiquity flows from its excellence and its ability to deliver results customers are looking for. "It would be an unprecedented decision to punish a company for winning on the merits," Google''s lawyer, John Schmidtlein, said late Friday afternoon in summation of the company''s closing arguments. Justice Department lawyer Ken Dintzer told the judge that "today must be the day" for him to step in and stop Google''s monopolistic behavior, which he likened to the tactics used by Microsoft two decades ago that prompted a similar antitrust battle. The US government, a coalition of states and Google all made their closing arguments Friday in the 10-week lawsuit to US District Judge Amit Mehta, who must now decide whether Google broke the law in maintaining a monopoly status as a search engine.
Meta Platforms Inc. (META) share price today is $451.96
Yes, Indians can buy shares of Meta Platforms Inc. (META) on Vested. To buy Meta Platforms Inc. from India, you can open a US Brokerage account on Vested today by clicking on Sign Up or Invest in META stock at the top of this page. The account opening process is completely digital and secure, and takes a few minutes to complete.
Yes, you can purchase fractional shares of Meta Platforms Inc. (META) via the Vested app. You can start investing in Meta Platforms Inc. (META) with a minimum investment of $1.
You can invest in shares of Meta Platforms Inc. (META) via Vested in three simple steps:
The 52-week high price of Meta Platforms Inc. (META) is $531.49. The 52-week low price of Meta Platforms Inc. (META) is $230.03.
The price-to-earnings (P/E) ratio of Meta Platforms Inc. (META) is 26.05
The price-to-book (P/B) ratio of Meta Platforms Inc. (META) is 8.51
The dividend yield of Meta Platforms Inc. (META) is 0.45%
The market capitalization of Meta Platforms Inc. (META) is $1.22T
The stock symbol (or ticker) of Meta Platforms Inc. is META
 Link copied


