

Invest in 5,000+ US Stocks and ETFs
* Offering through VF Securities, Inc. (member FINRA/SIPC)
 Skip to content
Brookfield Corporation is an alternative asset manager and REIT/Real Estate Investment Manager firm focuses on real estate, renewable power, infrastructure and venture capital and private equity assets. It manages a range of public and private investment products and services for institutional and retail clients. It typically makes investments in sizeable, premier assets across geographies and asset classes. It invests both its own capital as well as capital from other investors. Within private equity and venture capital, it focuses on acquisition, early ventures, control buyouts and financially distressed, buyouts and corporate carve-outs, recapitalizations, convertible, senior and mezzanine financings, operational and capital structure restructuring, strategic re-direction, turnaround, and under-performing midmarket companies. It invests in both public debt and equity markets. It invests in private equity sectors with focus on Business Services include infrastructure, healthcare, road fuel distribution and marketing, construction and real estate; Industrials include manufacturers of automotive batteries, graphite electrodes, returnable plastic packaging, and sanitation management and development; and Residential/ infrastructure services. It targets companies which likely possess underlying real assets, primarily in sectors such as industrial products, building materials, metals, mining, homebuilding, oil and gas, paper and packaging, manufacturing and forest product sectors. It invests globally with focus on North America including Brazil, the United States, Canada; Europe; and Australia; and Asia-Pacific. The firm considers equity investments in the range of $2 million to $500 million. It has a four-year investment period and a 10-year term with two one-year extensions. The firm prefers to take minority stake and majority stake. Brookfield Corporation was founded in 1997 and based in Toronto, Canada with additional offices across Northern America; South America; Europe; Middle East and Asia. more
| Time Frame | BN | Sector | S&P500 |
|---|---|---|---|
| 1-Week Return | 4.08% | -0.88% | -0.64% |
| 1-Month Return | 4.64% | -2.86% | -2.75% |
| 3-Month Return | 10.79% | 4.8% | 2.89% |
| 6-Month Return | 28.75% | 20.82% | 17.07% |
| 1-Year Return | 39.24% | 28.85% | 25.71% |
| 3-Year Return | 18.72% | 17.46% | 26.45% |
| 5-Year Return | 73.93% | 59.56% | 86.7% |
| 10-Year Return | 227.94% | 243.55% | 222.9% |
| Dec '19 | Dec '20 | Dec '21 | Dec '22 | Dec '23 | 5YR TREND | |
|---|---|---|---|---|---|---|
| Total Revenue | 67.83B | 62.75B | 75.73B | 92.77B | 104.30B | [{"date":"2019-12-31","value":65.03,"profit":true},{"date":"2020-12-31","value":60.16,"profit":true},{"date":"2021-12-31","value":72.61,"profit":true},{"date":"2022-12-31","value":88.94,"profit":true},{"date":"2023-12-31","value":100,"profit":true}] |
| Cost of Revenue | 52.73B | 47.39B | 64.00B | 78.51B | 66.16B | [{"date":"2019-12-31","value":67.16,"profit":true},{"date":"2020-12-31","value":60.36,"profit":true},{"date":"2021-12-31","value":81.52,"profit":true},{"date":"2022-12-31","value":100,"profit":true},{"date":"2023-12-31","value":84.27,"profit":true}] |
| Gross Profit | 15.10B | 15.37B | 11.73B | 14.26B | 38.14B | [{"date":"2019-12-31","value":39.58,"profit":true},{"date":"2020-12-31","value":40.29,"profit":true},{"date":"2021-12-31","value":30.76,"profit":true},{"date":"2022-12-31","value":37.38,"profit":true},{"date":"2023-12-31","value":100,"profit":true}] |
| Gross Margin | 22.26% | 24.49% | 15.49% | 15.37% | 36.57% | [{"date":"2019-12-31","value":60.87,"profit":true},{"date":"2020-12-31","value":66.96,"profit":true},{"date":"2021-12-31","value":42.36,"profit":true},{"date":"2022-12-31","value":42.03,"profit":true},{"date":"2023-12-31","value":100,"profit":true}] |
| Operating Expenses | 4.97B | 5.89B | 116.00M | 122.00M | 18.13B | [{"date":"2019-12-31","value":27.44,"profit":true},{"date":"2020-12-31","value":32.51,"profit":true},{"date":"2021-12-31","value":0.64,"profit":true},{"date":"2022-12-31","value":0.67,"profit":true},{"date":"2023-12-31","value":100,"profit":true}] |
| Operating Income | 13.91B | 10.18B | 16.91B | 17.19B | 20.02B | [{"date":"2019-12-31","value":69.48,"profit":true},{"date":"2020-12-31","value":50.86,"profit":true},{"date":"2021-12-31","value":84.5,"profit":true},{"date":"2022-12-31","value":85.89,"profit":true},{"date":"2023-12-31","value":100,"profit":true}] |
| Total Non-Operating Income/Expense | (15.29B) | (15.85B) | (9.80B) | (21.23B) | (30.64B) | [{"date":"2019-12-31","value":-1528500000000,"profit":false},{"date":"2020-12-31","value":-1584900000000,"profit":false},{"date":"2021-12-31","value":-980500000000,"profit":false},{"date":"2022-12-31","value":-2123100000000,"profit":false},{"date":"2023-12-31","value":-3063723222200,"profit":false}] |
| Pre-Tax Income | 5.85B | 1.54B | 14.71B | 6.66B | 4.12B | [{"date":"2019-12-31","value":39.76,"profit":true},{"date":"2020-12-31","value":10.49,"profit":true},{"date":"2021-12-31","value":100,"profit":true},{"date":"2022-12-31","value":45.3,"profit":true},{"date":"2023-12-31","value":28.02,"profit":true}] |
| Income Taxes | 495.00M | 837.00M | 2.32B | 1.47B | 1.03B | [{"date":"2019-12-31","value":21.3,"profit":true},{"date":"2020-12-31","value":36.02,"profit":true},{"date":"2021-12-31","value":100,"profit":true},{"date":"2022-12-31","value":63.21,"profit":true},{"date":"2023-12-31","value":44.3,"profit":true}] |
| Income After Taxes | 5.35B | 707.00M | 12.39B | 5.20B | 3.09B | [{"date":"2019-12-31","value":43.22,"profit":true},{"date":"2020-12-31","value":5.71,"profit":true},{"date":"2021-12-31","value":100,"profit":true},{"date":"2022-12-31","value":41.94,"profit":true},{"date":"2023-12-31","value":24.97,"profit":true}] |
| Income From Continuous Operations | 5.35B | 707.00M | 12.39B | 5.20B | 2.02B | [{"date":"2019-12-31","value":43.22,"profit":true},{"date":"2020-12-31","value":5.71,"profit":true},{"date":"2021-12-31","value":100,"profit":true},{"date":"2022-12-31","value":41.94,"profit":true},{"date":"2023-12-31","value":16.27,"profit":true}] |
| Income From Discontinued Operations | - | - | - | - | - | [{"date":"2019-12-31","value":"-","profit":true},{"date":"2020-12-31","value":"-","profit":true},{"date":"2021-12-31","value":"-","profit":true},{"date":"2022-12-31","value":"-","profit":true},{"date":"2023-12-31","value":"-","profit":true}] |
| Net Income | 5.35B | 707.00M | 12.39B | 5.20B | 1.13B | [{"date":"2019-12-31","value":43.22,"profit":true},{"date":"2020-12-31","value":5.71,"profit":true},{"date":"2021-12-31","value":100,"profit":true},{"date":"2022-12-31","value":41.94,"profit":true},{"date":"2023-12-31","value":9.12,"profit":true}] |
| EPS (Diluted) | 1.73 | (0.12) | 2.39 | 1.77 | 1.64 | [{"date":"2019-12-31","value":72.38,"profit":true},{"date":"2020-12-31","value":-5.02,"profit":false},{"date":"2021-12-31","value":100,"profit":true},{"date":"2022-12-31","value":74.06,"profit":true},{"date":"2023-12-31","value":68.62,"profit":true}] |
These ratios help you determine the liquidity of the company. Higher is better.
| BN | |
|---|---|
| Cash Ratio | 0.18 |
| Current Ratio | 0.51 |
| Quick Ratio | 0.44 |
These ratios help you understand the company's efficiency in using its assets to generate returns. Higher is better. For ROE, average long term is around 14%, less than 10% is poor.
| BN | |
|---|---|
| ROA (LTM) | 2.22% |
| ROE (LTM) | 3.29% |
These ratios help you understand the company's liabilities, gauging the riskiness of the investment.
| BN | |
|---|---|
| Debt Ratio Lower is generally better. Negative is bad. | 0.66 |
| Common Equity/Total Assets Higher is better. Lower can suggest investment is riskier. | 0.09 |
| Debt/Equity The higher the number, the more leverage the business employs, the riskier the investment typically is. | 10.71 |
These ratios help you understand the company's valuation. Lower may indicate cheaper stocks.
| BN | |
|---|---|
| Trailing PE | 68.28 |
| Forward PE | 11.64 |
| P/S (TTM) | 0.61 |
| P/B | 1.43 |
| Price/FCF | NM |
| EV/R | 2.93 |
| EV/Ebitda | 9.15 |
| PEG | NM |

Are you looking for renewable energy stocks to buy? The world is at a critical juncture in the fight against climate change, and the transition to renewable energy is more important than ever. As countries set targets to reduce their carbon emissions, like the United Nation’s Net Zero Coalition, the demand for clean energy solutions is increasing exponentially. As someone who has been trading stocks and options since 1999, I’ve witnessed an accelerated shift toward a more sustainable future with the help of renewable energy; I consider this a perfect opportunity to look into renewable energy stocks. Three renewable energy stocks to buy are making waves in the sector and are offering solid investment potential based on their overall performance. For this analysis, I’ve started with a screen of the top 30 Renewable Energy Companies based on the Market Cap. Then, I filtered the list for the following criteria: Year-on-year quarterly net income growth of over 30%, Analyst rating of 4 and above (moderate to strong buy) and An upside potential of over 50% based on high target prices.
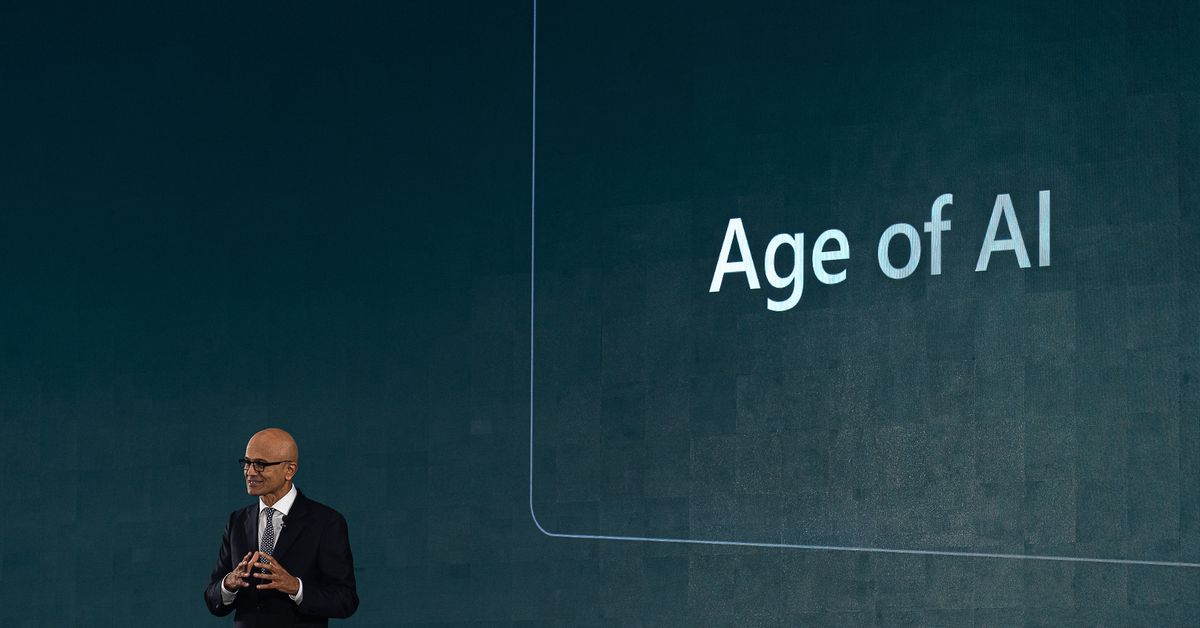
Satya Nadella, the executive chairman and CEO of Microsoft Corporation speaks during the “Microsoft Build: AI Day” event. | Photo by Peerapon Boonyakiat / SOPA Images / LightRocket via Getty Images Microsoft just agreed to support the development of 10.5 gigawatts of new renewable energy capacity around the world, a massive amount of electricity to fuel its AI ambitions and climate goals. For comparison, 10.5 GW of renewable energy amounts to nearly half the amount of solar and wind capacity California had in 2022 . This is quite literally a very big deal — effectively the largest corporate agreement to purchase renewable energy to date, according to BloombergNEF . Microsoft inked the agreement yesterday with Brookfield Asset Management, which said the deal is almost eight times bigger than what was previously the single largest corporate power purchase agreement ever signed. Microsoft is pumping a lot of its resources into AI o… Continue reading…
Brookfield Asset Management and its clean energy platform Brookfield Renewable announced today a new 5-year […]
SAN FRANCISCO, May 2 — Microsoft and Canada’s Brookfield Asset Management have struck an agreement for the development o…

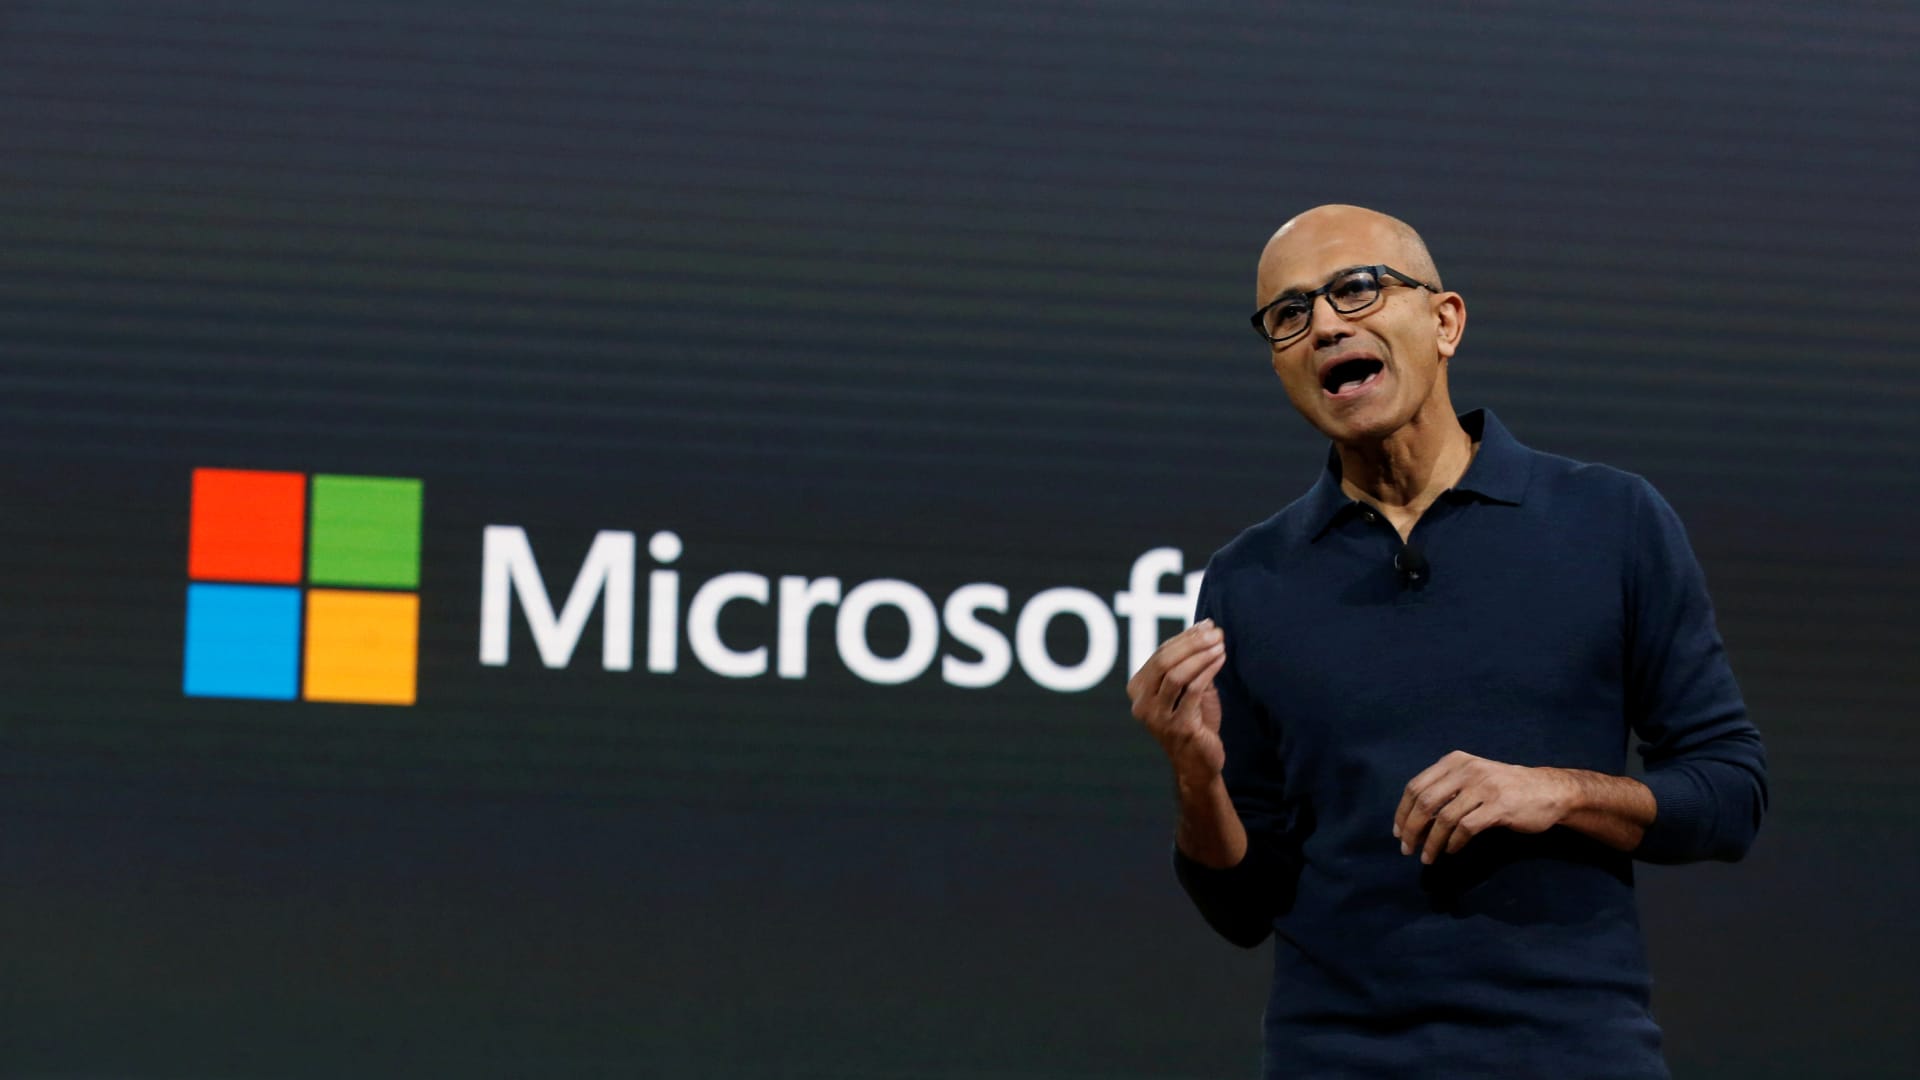
Microsoft Chief Executive Officer (CEO) Satya Narayana Nadella speaks at a live Microsoft event in the Manhattan borough of New York City, October 26, 2016. Lucas Jackson | Reuters Microsoft has signed a deal with Brookfield Asset Management to invest more than $10 billion to develop renewable energy capacity to power the growing demand for […] The post Microsoft, Brookfield to develop more than 10.5 gigawatts of renewable energy appeared first on UK Stocks, Forex, Commodities, Crypto, Live Market News- Daily Forex News .
Microsoft and Brookfield Asset Management will develop 10.5 gigawatts of renewable energy, in a deal they describe as the largest of its kind.

Microsoft Corp. agreed a major long-term deal with the green energy arm of Brookfield Asset Management to supply power to the software giant as it ramps up investment in artificial intelligence.
Microsoft Corp. agreed a major long-term deal with the green energy arm of Brookfield Asset Management to supply power to the software giant as it ramps up investment in artificial intelligence.
Brookfield Corp (BN) share price today is $42.63
Yes, Indians can buy shares of Brookfield Corp (BN) on Vested. To buy Brookfield Corp from India, you can open a US Brokerage account on Vested today by clicking on Sign Up or Invest in BN stock at the top of this page. The account opening process is completely digital and secure, and takes a few minutes to complete.
Yes, you can purchase fractional shares of Brookfield Corp (BN) via the Vested app. You can start investing in Brookfield Corp (BN) with a minimum investment of $1.
You can invest in shares of Brookfield Corp (BN) via Vested in three simple steps:
The 52-week high price of Brookfield Corp (BN) is $43.17. The 52-week low price of Brookfield Corp (BN) is $28.73.
The price-to-earnings (P/E) ratio of Brookfield Corp (BN) is 70.23
The price-to-book (P/B) ratio of Brookfield Corp (BN) is 1.43
The dividend yield of Brookfield Corp (BN) is 0.77%
The market capitalization of Brookfield Corp (BN) is $70.00B
The stock symbol (or ticker) of Brookfield Corp is BN
 Link copied


